
Monitor service uptime
A website can appear reliable for weeks and then become unreachable exactly when a customer needs it. Uptime monitoring checks the service at regular intervals and alerts you when a real outage is detected.
Choose what to monitor
The right check depends on what you need to confirm. A webpage, a network port, and an automated job provide different kinds of evidence.
Webpage
An HTTP or HTTPS request confirms that the server responds. An optional search string can also verify that the page contains expected text instead of merely returning a response.
TCP port
A connection to a specific port can monitor a network service such as HTTPS, SSH, or a mail server. This confirms that the port accepts a connection without validating the application’s complete logic.
Heartbeat
A scheduled task or private server periodically calls a generated URL. This method is useful for backups, cron jobs, and systems located behind a firewall or VPN.
Configure monitoring with Simple Ping
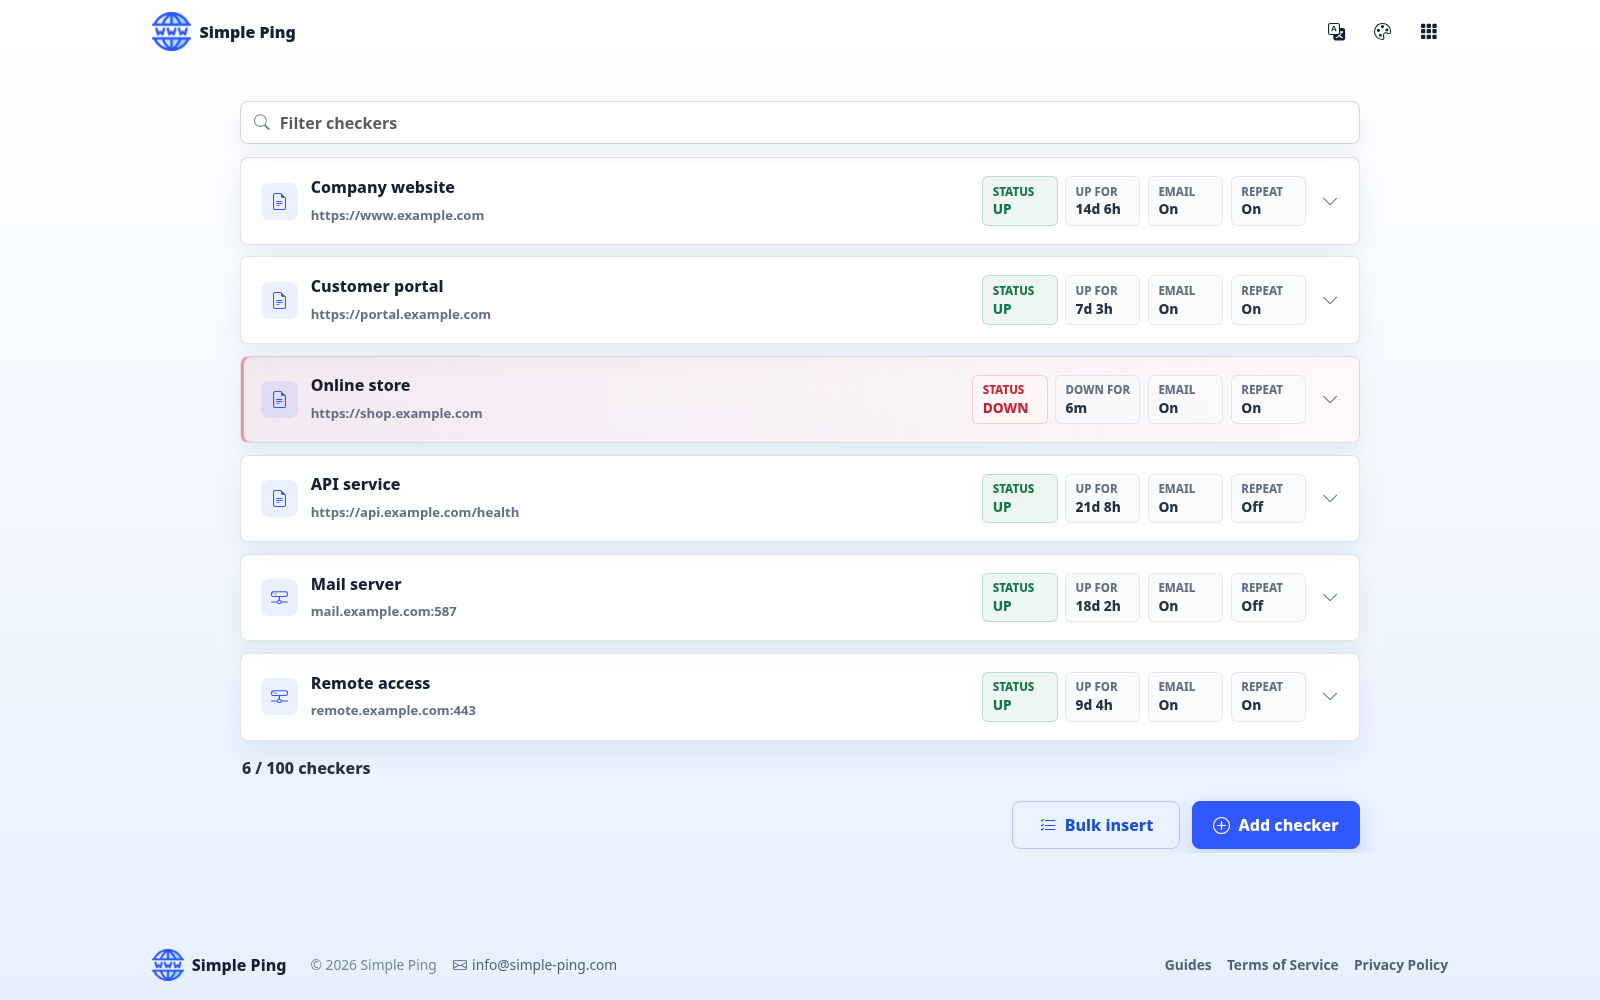
Simple Ping brings checks together in a focused dashboard. Each checker has its own target and alert settings.
- Create an account. Access is passwordless: sign in with a code received by email or a saved passkey.
- Add a checker. Choose Webpage, Port, or Heartbeat based on the result you need to measure.
- Identify the service. Add a display name and, when useful, a group such as Clients, Production, or Infrastructure.
- Enter the target. For a webpage, use the complete URL. For a port, enter the hostname or IP address and port number. For a heartbeat, choose the expected interval and then use the generated URL.
- Configure alerts. Enable email notifications, choose how many consecutive failures make the service down, and decide whether the alert should repeat.
- Verify and save. Check state now confirms webpages and ports before saving. A heartbeat begins monitoring after its first callback.
Reduce false alerts
One slow response does not always mean that a service is truly down. A good configuration balances fast notification with unnecessary noise.
- Webpage checks retry transient failures before deciding that a page is unavailable.
- The consecutive-failure threshold can be set from 1 to 5. A higher threshold reduces alerts caused by very brief interruptions.
- A search string confirms that important content is present even when the server returns a successful HTTP status.
- For a heartbeat, choose an interval slightly longer than the job’s normal execution schedule to account for routine variation.
Respond to an alert
When a checker goes down, the email identifies the affected service. Open that checker in the dashboard to review the start time, duration, recovery time, and recorded technical reason.
History preserves every downtime period and the uptime between incidents. A description field lets you record the cause or the work performed, turning alerts into a useful operational log.
For content checks, the source received at the time of failure can also be viewed without executing the page. This helps distinguish an error page, redirect, or incomplete response.
Start monitoring a service
Add your first website, network port, or heartbeat in Simple Ping.
Contact
info@systemsmw.com
Monday-Friday: 8am - 5pm
Get Started
What do you need?